Activity 4.1 c
In this activity you will collect and analyze data in order to make predictions based on that data. You will use both manual and computer methods to record, manipulate, and analyze the data in order to determine mathematical relationships between quantities. These mathematical relationships can be represented graphically and by equations, also known as mathematical models. You will then use the mathematical models to make predictions related to the quantities.
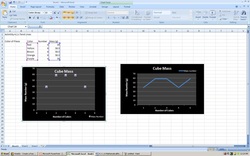
3a. If I were to measure the mass of pieces with more than six cubes or fewer than four cubes, the point would most likely not be in a straight line because it’s a certain consistency that it has with only 5 if its four it would not increase but if it was more than five cubes It would increase to where it would not be a straight line
b. Slightly where it would almost be a line-of-best fit
c. my prediction of one wooden cube mass would be 3g
Conclusion
1. What is the advantage of using Excel for data analysis?
Its a quick way to not do any mathematical problems by hand, just simply keying the formula in
2. What precautions should you take to make accurate predictions?
By thinking ahead of the possible outcomes there is to come and to avoid them before it happens as well as fixing.
3. What is a function? Explain why the mathematical models that you found in this activity are functions.
A function is a relationship or expression involving one or more variables. The mathematical model that are found in this activity are functions because its an expression that as multiple variables involved.
4. Are all lines functions? Explain.
No, if no vertical line cuts it more than once then it can be a function but if not than no
